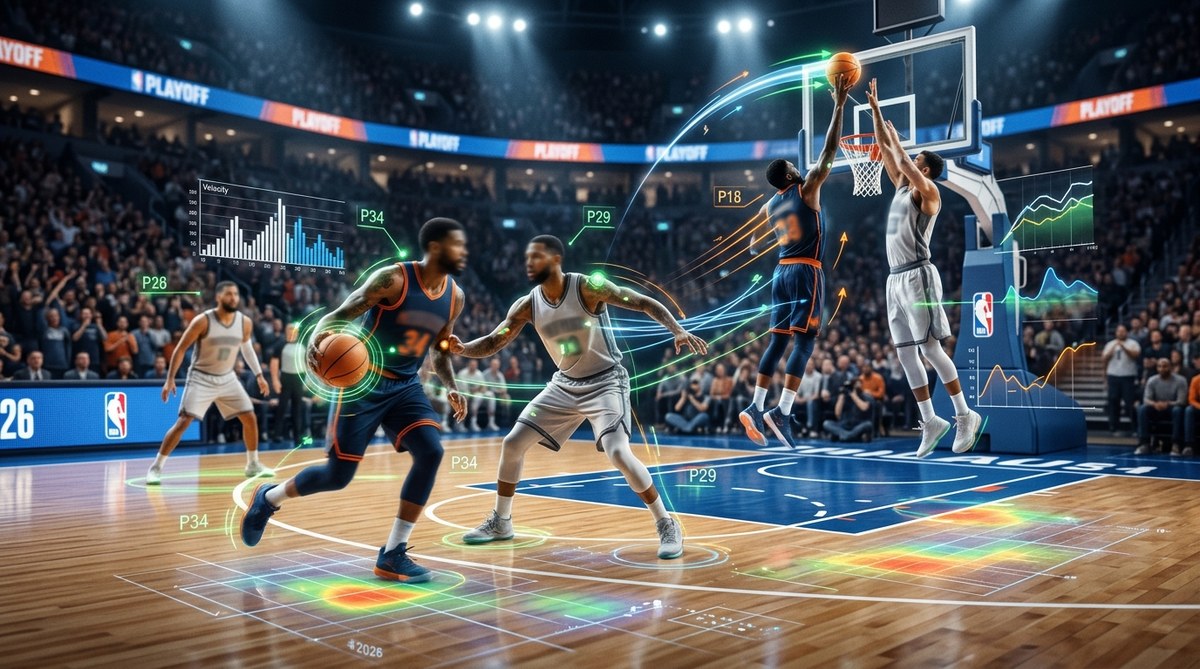
The intensity of an NBA playoff game in 2026 feels different. The crowd is louder, the stakes are higher, and every movement on the court matters more than ever. But something else has changed behind the scenes. The playoffs have quietly become the most important testing ground for a new wave of player tracking technology. Coaches, trainers, and front offices are no longer relying on just box scores and video replays. They are using data pulled from sensors, cameras, and artificial intelligence to understand exactly what happens when a player pushes their body to the limit.
The 2026 NBA playoffs are serving as a live laboratory for next-gen player tracking technology. Teams are testing wearable sensors, AI-driven motion capture, and real-time biomechanical analysis under the highest pressure conditions. This data helps coaches make smarter substitution decisions, reduces injury risk, and gives analysts a new vocabulary for describing athletic performance. The results from this postseason will shape how the entire league uses tracking tools for years to come.
Why the Playoffs Are the Perfect Testing Ground
Regular season games provide plenty of data, but they lack the unique pressure of a playoff environment. When a player is fighting for a championship, their body responds differently. Fatigue sets in faster. Adrenaline masks pain. Decision-making under duress changes. For tracking technology to be truly useful, it needs to capture these extreme states.
The playoffs offer a concentrated window of high-stakes competition. Teams play more frequently, travel less, and face the same opponent multiple times in a series. This creates a controlled environment where data scientists can compare performance across consecutive games. They can see how a player’s gait changes from game one to game seven. They can measure how quickly a star point guard recovers between possessions.
This is why the NBA and several technology partners have turned the postseason into a live lab. The data collected during a playoff series is richer and more actionable than anything gathered during the long regular season grind.
The Core Technologies Being Tested Right Now
Player tracking in 2026 is not a single gadget. It is a stack of systems working together. Let’s break down the main pieces being deployed during these playoff games.
Wearable Sensors Embedded in Gear
The most visible change is the integration of lightweight sensors into compression shirts, shoes, and even wristbands. These sensors measure heart rate variability, skin temperature, and muscle activation. Unlike older devices that felt bulky, the 2026 versions are nearly unnoticeable. Players forget they are wearing them.
Teams use this data to monitor workload in real time. If a player’s muscle fatigue readings spike, the coaching staff can adjust minutes or call a timeout to let them recover. This is especially valuable in a playoff series where a single injury can change the entire outcome.
AI-Powered Optical Tracking
Cameras placed around the arena capture every player’s position at 120 frames per second. An AI system processes this video feed to create a 3D skeleton of each athlete. It tracks joint angles, acceleration patterns, and even the micro-adjustments a player makes before taking a shot.
This technology, often called markerless motion capture, does not require players to wear any special suits. It works with standard broadcast cameras, though the playoff games use upgraded units for higher precision. The AI can flag a change in a player’s running form that might indicate a developing knee issue.
Real-Time Biomechanical Analysis
The most advanced layer combines the sensor data and the optical tracking into a single dashboard. A team of analysts sits courtside or in a back room, watching a live feed of metrics. They can see the exact force a player generates during a jump, the torque on their ankle during a lateral cut, and the efficiency of their shooting motion.
This information is not just for injury prevention. It also helps with strategy. If the data shows that a defender is losing half a step of lateral speed after the third quarter, the opposing coach can target that player more aggressively on offense.
How Teams Use This Data During a Game
The flow of information from the court to the decision-makers is critical. Here is a practical look at how the process works during a playoff game in 2026.
-
Data capture begins at tip-off. Sensors and cameras start recording the moment the ball is in the air. The system establishes a baseline for each player based on their first two minutes of play.
-
The AI processes movement in real time. Within seconds, the system identifies any deviation from the player’s normal biomechanical profile. If a player’s stride length shortens by more than 5%, an alert is sent to the team’s performance staff.
-
The coaching staff reviews a live dashboard. A tablet or laptop shows a simplified view of the key metrics. The head coach can see a color-coded system: green for normal, yellow for elevated fatigue, red for high injury risk. This allows for quick decisions on substitutions.
This numbered process is becoming standard practice for teams that have invested in the technology. It turns subjective observations into objective data.
A Closer Look at the Metrics
To understand what analysts are actually looking at, here is a table of the most common tracking metrics used during the 2026 playoffs.
| Metric | What It Measures | Why It Matters in the Playoffs |
|---|---|---|
| Heart rate recovery slope | How quickly heart rate drops after a sprint | Indicates cardiovascular fatigue and readiness |
| Ground contact time | Duration each foot is on the floor during a stride | Shorter contact time often means fresher legs |
| Joint angle variability | Changes in knee and hip angles over a game | Early sign of compensatory movement due to pain |
| Muscle oxygen saturation | Oxygen levels in working muscles | Drops signal local fatigue before the player feels it |
| Acceleration asymmetry | Difference in push-off force between legs | Can reveal an unsteady ankle or hip issue |
These numbers give coaches a language for explaining a gut feeling. Instead of saying “he looks tired,” they can point to a specific metric.
What the Analysts and Experts Are Saying
The people working with this data every night have strong opinions about its potential.
“We are seeing things we never could with the naked eye. In the past, a coach would wait until a player limped to notice a problem. Now we can see the biomechanical signature of fatigue three minutes before it shows up in their movement. The playoffs are the ultimate stress test for this system.”
— Lead performance analyst for a Western Conference playoff team
This sentiment is echoed by data journalists who cover the league. They argue that the 2026 playoffs will be remembered as the moment tracking technology moved from a novelty to a necessity.
Common Mistakes Teams Make When Adopting This Tech
Not every team has mastered the art of using player tracking data. Here are the most frequent errors, along with how to avoid them.
- Overloading coaches with raw numbers. A dashboard with 50 metrics is useless during a timeout. The best teams distill the data down to three or four actionable signals.
- Ignoring the player’s own feedback. Data should complement what a player feels, not override it. Some teams have made the mistake of pulling a player based on a metric spike when the player felt fine, causing frustration.
- Failing to calibrate for individual baselines. Every athlete has a unique movement pattern. Comparing a point guard’s metrics to a center’s metrics is meaningless without proper calibration.
- Using the data only for injury prevention. The same data that flags fatigue can also reveal when a player is peaking. Smart coaches use it to decide who should take the big shot in the final minutes.
What This Means for the Future of the Sport
The experiments happening during the 2026 playoffs will not stay confined to the postseason. The lessons learned here will trickle down to regular season games, college basketball, and eventually to amateur leagues. The technology is getting cheaper and smaller every year. A high school team could have access to a simplified version of this system within a few seasons.
For analysts and data journalists, this is an exciting time. The vocabulary of basketball is expanding. Terms like “ground contact time” and “acceleration asymmetry” will become as common as “points per game” and “assist-to-turnover ratio.” The story of a playoff series will include not just the final score, but the hidden physical battles that played out on a microscopic level.
If you want to understand where sports technology is heading, keep an eye on how your favorite team uses tracking data during the playoffs. The tools being tested right now are shaping the next generation of athlete performance. For a broader look at what is changing in the world of sports, check out our coverage of the top 10 emerging sports trends you need to watch in 2026. And if you are curious about the broader impact of data on training, our article on how technology is revolutionizing athlete training and performance goes even deeper.
The Playoff Lab Will Change How We Watch Basketball
The next time you watch a playoff game, remember that the players are not just competing against each other. They are also being measured, analyzed, and optimized by systems that barely existed five years ago. The data coming out of these games will influence draft picks, contract negotiations, and training methods for the next decade. It is a fascinating moment for anyone who loves the intersection of sports and technology.
So pay attention to the numbers behind the highlights. They tell a story that the broadcast cameras cannot capture. And if you are a data journalist or an analyst, now is the perfect time to start learning these metrics. The 2026 playoffs are giving us a preview of what basketball will look like for the rest of the decade.